This tutorial’s goal is to get you comfortable debugging your own code,
since you are both the one who made the mistake and the one who has to find it.
By the end of this tutorial, you should be able to:
Debug with printf, and keep debug output out of your program’s real output with fprintf
Use GDB to pause a running program and inspect its variables
Getting Started
The files for the non-graded exercises are already available in the tutorial folder.
Open a terminal and change to that folder:
cd ~/tutorial
Run the following command:
make test
It should print the program’s output, followed by PASS.
Introduction
No one writes correct code the first time.
Even experienced programmers spend more time debugging than writing1.
The goal is not to get it right immediately,
it’s to develop a systematic way of finding and fixing mistakes when they happen.
We will cover two common ways to debug your code.
The first is printf debugging: sprinkling print statements everywhere until something makes sense.
It is scrappy, but it works, and most programmers reach for it first.
The second is using a proper debugger like gdb, which lets you pause your program and look around inside it.
We will cover both.
Debugging with printf
Printf debugging is the simplest approach you can take: add a printf statement, run the program, and see what it prints.
It requires no setup and works anywhere.
Add printf statements in debug.c to print the values of a and b.
Run make test again, and notice how the check fails.
The downside is that print statements tend to accumulate over time,
and forgetting to remove them can clutter your output or interfere with test cases.
We will look at two ways to manage that.
Using fprintf
fprintf works like printf,
but lets you route debug messages somewhere else,
keeping them separate from your program’s actual output,
so you can leave them in without interfering with test cases.
Modify your print statements in debug.c to use fprintf instead of printf.
The syntax is the same, except you add stderr as the first argument:
fprintf(stderr, "a = %d\n", a);
Run make test again, and notice how the check passes.
stderr is a second output channel that the check does not read.
We’ll cover it properly in a future tutorial. Debug Macro (Extra)
With fprintf, the print statements are still in your code.
If you want them gone entirely without deleting them manually,
you can use a debug macro:
#ifdef DEBUG fprintf(stderr, "a = %d\n", a);#endif
Pass -DDEBUG when compiling to include them,
or leave it out to remove them all at once.
Wrap your print statements in debug.c with the #ifdef DEBUG macro above,
then compile with and without -DDEBUG to see the difference.
GNU Debugger (GDB)
Imagine being able to freeze time in the middle of your program: everything is paused, and you can walk
around inspecting every variable, then resume or step forward one line when you are ready.
That is what a debugger does.
Debuggers serve two kinds of people.
The first group uses them to find bugs in code they wrote.
The second group uses them to understand code they did not write, sometimes without access to the source at all.
In CS1010, we are firmly in the first group.
Printf vs GDB
With printf, you decide what to observe before you run the program.
With GDB, you decide as you go.
In practice, printf is usually faster when you wrote the code and know it well.
There is overhead to using a debugger: you leave your editor, learn a new interface, and set things up before
you can start.
That overhead pays off when you are staring at unfamiliar code, whether it was generated by AI, written by
someone else, or when your TA is stepping through your submission.
Opening an Executable in GDB
Tip
Remember to compile with debug information with the -g flag.
There are two ways to open an executable in gdb.
Specify the filename when starting gdb: gdb <filename>
If you forget to specify the filename: Type file <filename>inside gdb
Compile the file debug.c, with -o debug and -g flags, and try opening the executable in gdb using both ways.
TUI Mode
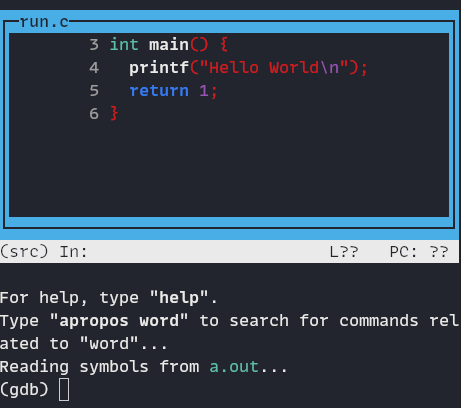
When debugging source code,
you almost always want to enable the Terminal User Interface (TUI).
It lets you type commands while showing you exactly where you are in the code.
Similar to opening an executable in gdb,
there are two ways to enter TUI mode.
Start gdb with the --tui flag: gdb --tui <filename>
If you did not start gdb with that flag, you can still enter TUI mode from within gdb:
Press Ctrl-X, followed by a
Mnemonic
Ctrl-X, a for “eXtra Awesome”.
Try entering the TUI mode using both ways.
Setting Breakpoints
A breakpoint marks a line where the debugger will pause its execution.
When a breakpoint is hit, that line has not been executed yet.
This is how you take control of program execution.
Without them, running code in a debugger is no different from running it normally.
You can set breakpoints using b <filename>:<line number> (e.g. b main.c:5).
If your program is compiled from a single file,
you can omit the <filename>
and the : (e.g. b 5).
You can use c, n or s to execute the next lines of code.
They stand for “continue”, “next”, and “step” respectively.
Explain the differences between continue, next and step
Tip
The UI might be messed up from the printing of the program, you can use Ctrl-L to refresh the screen.
Viewing Variables
To view the content of a variable, you can use print (or p for short): p var.
If you want to print a variable after every command execution,
you can use display: display var.
To undisplay, use undisplay instead of display.
Let’s try to print some variables.
Set breakpoint at the start of the main function: b main
Start the program: start
Execute the first line: n
Print the value of variable a: p a
You can treat the syntax a bit like C, where you can print the address of a: p &a. (If the variable is a pointer, you can use * to dereference a pointer)
Let’s explore the usage of display.
Set breakpoint at the start of the find_max function: b find_max
Start the program: start
Execute to breakpoint: c
Display the value of variable max: display max
Step through the function using n and observe the changes of max
Viewing the Return Value of a Function
To view the return value of a function,
use the finish command to run until the current function returns.
Set a breakpoint at the find_max1 function: b find_max1
Start the program: start
Continue to breakpoint: c
Type finish to see the return value
Copying text in GDB TUI
You can copy text without leaving TUI mode:
Hold Shift
While holding it, click and drag across the text to select it
Release the mouse, then release Shift
Press Ctrl-Shift-C to copy
Paste with Ctrl-Shift-V.
Holding Shift temporarily gives the terminal control of the mouse.
Graded Task(s)
Enter the Graded Task Folder
Run cd ~/tutorial-graded before continuing
Bob has a challenge for you.
He has a program called verify,
that prompts for a secret.
He claims that you won’t be able to find the secret,
because he only gives you partial source code.
That ensures that you can’t view the source code to see the secret,
or recompile the program to add printf statements.
Find the secret and provide it as input to the program.
Run the program with:
./verify
Important
You have to run the program outside of gdb to complete the task.
Before you leave: verify your progress
Run this command inside your Tutorial environment:
progress
It shows whether you have successfully completed the tutorial and which
individual tasks have been recorded as complete.
The progress command is available only inside a Tutorial environment, not in
the general CS1010 WebTop environment.
Footnotes
You will spend more time editing code than writing it from scratch,
so knowing your editor well pays off.
Time spent in vim is never wasted. ↩